 Weekly Real Estate News

Summary
Rightmove's November 16 index shows average newly listed UK home asking prices down 1.8% to £364,270, compared with the typical 1.1% November decline. High mortgage rates, a 12-year inventory high and weaker buyer demand are shifting leverage toward purchasers; these are asking prices, not completed-sale prices.
British home sellers cut their initial asking prices more sharply than usual in November, a sign that elevated mortgage costs and abundant listings are putting greater pressure on pricing.
The average asking price of a newly marketed property fell 1.8%, or £6,745, to £364,270, according to Rightmove’s November 16 House Price Index. The typical November decline over the previous decade was 1.1%. The average asking price was also 0.2% below a year earlier.
The figures cover 86,715 properties listed by estate agents between October 11 and November 7. They describe sellers’ initial price expectations, not completed transaction prices, and should not be read as a 1.8% fall in the value of every British home.






Mortgage costs are changing the negotiation
Rightmove put the average two-year fixed mortgage rate at 5.51%, down slightly from 5.55% a month earlier but considerably above the 4.25% recorded earlier this year. The company estimates that this increase adds more than £200 per month to the cost of a typical new mortgage. Its quoted average two-year tracker rate, 4.72%, is lower, but tracker borrowers bear the risk of future rate changes.
Higher financing costs do not necessarily halt a housing market. They can instead force a change in the price at which a buyer and seller can reach an agreement. Sellers who anchored their expectations to earlier, cheaper borrowing conditions now face households calculating monthly payments at a very different rate.
Buyer inquiries were 8% lower than a year earlier and sales agreed were down 7%, while new listings increased 3%, Rightmove reported. The number of homes available for sale was at a 12-year high. Together, those figures point to more negotiating room for buyers, although they do not mean every market or property type is equally weak.
Regional and property-type differences remain substantial
Annual asking-price performance ranged from a 1.1% decline in the South West to a 3.8% increase in Scotland. Flats were down 1.7% year over year, compared with a modest 0.1% increase for houses. Over a decade, Rightmove calculated asking-price growth of just 5% for flats against 30% for houses.
The divergence matters for brokers and estate agents: a national average obscures important differences in local inventory, property condition, service charges and the financing choices available to buyers. It also limits how much can be inferred from a single monthly reading.
What the report means beyond Britain
The report offers a useful international comparison for U.S. real estate professionals confronting the same broad affordability question: what happens when financing costs remain elevated even as homes stay available for sale? Britain’s mortgage products, monetary policy and housing supply differ from those in the United States, so its figures cannot be transferred directly to American markets.
For British sellers, the near-term issue is whether asking prices adjust enough to turn browsing into transactions. For buyers, greater selection can improve negotiating leverage, but a lower sticker price does not automatically offset a higher monthly mortgage payment. Future completed-sales data will provide a more definitive test of whether the shift in listing expectations becomes a wider change in achieved prices.
Rightmove’s house-price-index series provides the underlying monthly comparisons. For context, WRE News previously reported on Rightmove’s October housing-market findings, when asking prices rose despite mortgage pressure.
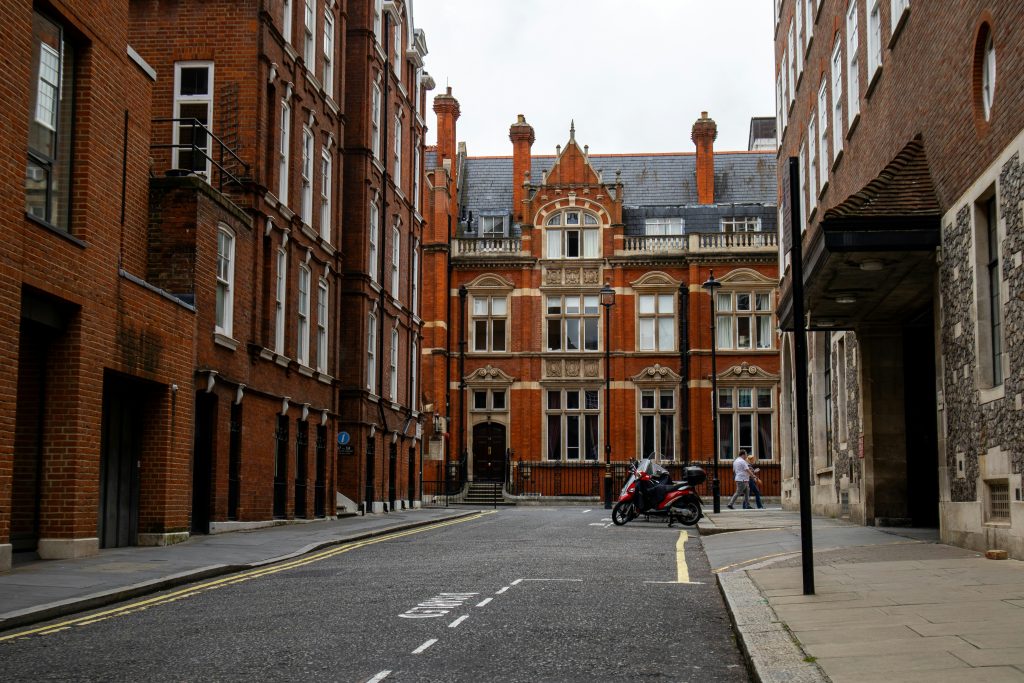
Featured photograph: Wyatt Simpson/Unsplash. Illustrative image of London housing, not properties included in the Rightmove sample.