 Weekly Real Estate News

Summary
ONS November 18 bulletin: UK house prices up 1.2% annually to £273,000 in September 2026, London down 3.5% and Inner London down 7.2%; UK average private rent £1,411 in October, up 3.8% annually. Different reporting months and price concepts; data provisional.
London home prices fell 3.5% over the year to September, even as average UK property prices rose modestly and private rents continued to increase. The divergence, documented in the Office for National Statistics’ November 18 housing release, highlights how differently the sales and rental markets are moving.
ONS estimated that the average UK home cost £273,000 in September 2026, up 1.2% from a year earlier. London was a notable exception: average prices fell 3.5% annually, while Inner London experienced a 7.2% decline, the largest annual fall for that area since August 2009. These are provisional figures and may be revised.
Rents remain on a different path
Average UK private rent reached £1,411 per month in October, a 3.8% increase from October 2025. The annual rate was unchanged from September. England’s average rose 4% to £1,472; Wales increased 3.9% to £849; and Scotland increased 0.7% to £1,015.






Rental inflation within England varied considerably. The North West registered the strongest annual growth at 5.6%, while the South West posted the lowest at 3.3%. The figures are not interchangeable with asking rents for newly marketed homes: the ONS Price Index of Private Rents measures a broader stock of privately rented accommodation.
The sales and rental statistics also refer to different months. House prices cover transactions in September, while the rental estimates refer to October. That distinction matters when comparing the two markets and interpreting short-term changes.
National averages conceal a sharper regional split
England’s average home price was £293,000 in September, an increase of 0.8% year over year. Wales reached £215,000, up 1.8%, and Scotland reached £198,000, up 2.3%. London therefore moved against the national direction.
The sharp Inner London decline also illustrates why a single UK average is an imperfect guide for lenders, agents and developers. Affordability, local supply, property mix and the distribution of high-value transactions can produce substantial differences between regional price series. The official figures describe observed price changes; they do not establish which factor caused London’s decline.
For mortgage lenders and estate agents, the combination of lower London values and rising rental costs complicates assumptions about buyer demand. Lower prices can improve the deposit-to-price ratio for some purchasers, but financing costs and qualification standards still determine whether households can transact. Renters, meanwhile, can face higher monthly outlays even in regions where sales prices are weakening.
The November 18 ONS bulletin is the primary source for the figures. Its release should not be confused with WRE News’ earlier coverage of Rightmove asking prices, which measures sellers’ advertised expectations rather than completed-sale prices.
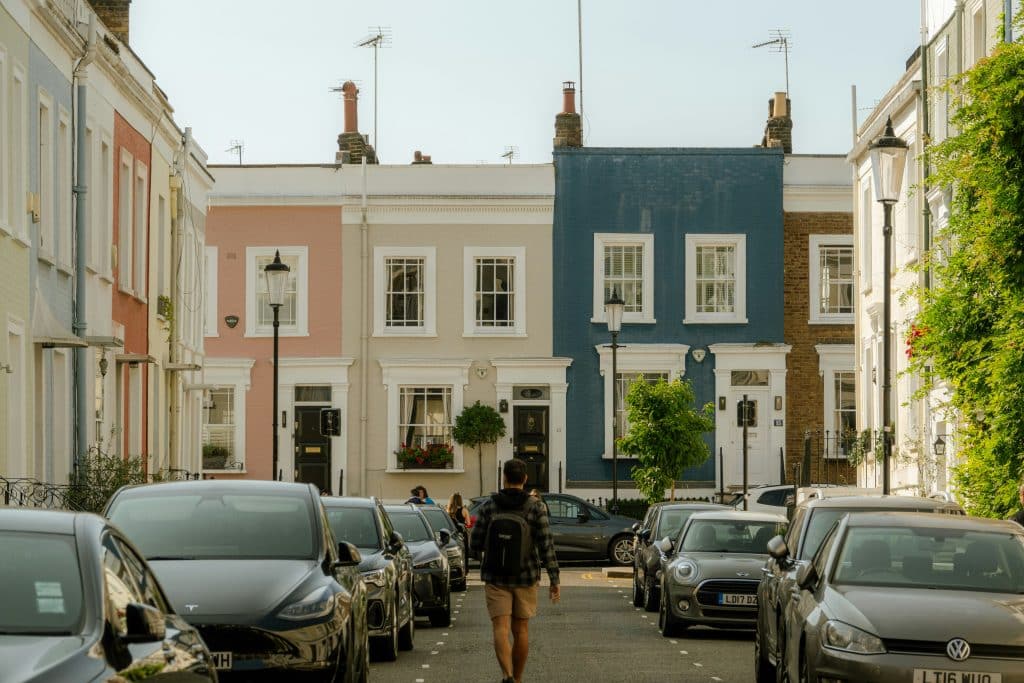
Illustrative image: Joylynn Goh/Unsplash. It does not depict a property included in the statistical sample.