



Summary
New FHFA data shows U.S. home prices increased 2.1% year over year in the second quarter of 2026, but the national average masks substantial differences among states, regions and metropolitan areas. John G. Stevens argues that national housing statistics remain valuable but should not be treated as descriptions of what consumers, agents, lenders and builders are experiencing in individual markets.
Every month, the housing industry gets another collection of national numbers. Home prices are up. Sales are down. Inventory is improving. Affordability is getting worse. Builder confidence moved. Mortgage applications changed.
We report those numbers because they matter. I read them because they matter.
But I increasingly wonder whether the way we talk about national housing data gives consumers—and sometimes our own industry—a picture of the market that doesn’t resemble what is happening where they actually live.
The latest home-price numbers are a good example.
FHFA reported this week that U.S. home prices increased 2.1% between the second quarter of 2025 and the second quarter of 2026. Prices increased in 46 states and the District of Columbia. Nationally, prices have now posted positive annual appreciation in every quarter since the beginning of 2012.
That sounds like a housing market where prices are still moving higher.
Then you start looking underneath the national number.
Alaska appreciated 8.3% over the year. Vermont was up 7.3%. Hawaii gained 5.8%. Illinois increased 5.6%, as did West Virginia when rounded to one decimal place.
New Mexico went the other direction, declining 1.2%.
At the census-division level, the East North Central region—which includes Michigan, Wisconsin, Illinois, Indiana and Ohio—appreciated 4.46%. The Pacific division, consisting of Hawaii, Alaska, Washington, Oregon and California, increased just 0.02%.
Those numbers all come from the same country during the same period.
Calling all of that “the U.S. housing market” is statistically convenient. It isn’t particularly useful if you are trying to decide what to offer on a house, price a listing, originate a mortgage or determine what type of home should be built in a particular community.
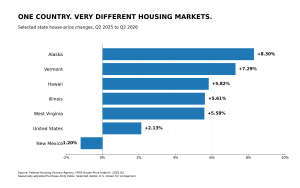
FHFA data shows how dramatically home-price trends differed across selected states in Q2 2026, despite a national annual increase of 2.13%
We’ve always known real estate is local. The difference is becoming harder to ignore.
“Real estate is local” may be one of the most repeated sentences in this business. I am not pretending we have suddenly discovered it.
What interests me is what happens when the distance between local markets becomes large enough that the national headline begins obscuring more than it explains.
FHFA’s own data makes the point.
The agency doesn’t produce only a national House Price Index. Its HPI includes information at the census-division, state, metropolitan-area, county, ZIP-code and census-tract levels. FHFA says the underlying indexes incorporate tens of millions of home sales and use a repeat-sales methodology to measure changes in single-family home values.
There is a reason that geographic detail matters.
In the latest metropolitan-area data, Urban Honolulu showed an 11.06% annual increase using FHFA’s all-transactions metropolitan index. Grand Junction, Colorado, was up 8.78%. Bloomington, Illinois, increased 8.71%.
The national purchase-only index increased 2.13%.
Those aren’t small differences around a common experience. They represent households, sellers and housing professionals operating in substantially different environments.
A homeowner in a rapidly appreciating market may still be dealing with multiple offers and very limited choices when they try to move. Someone elsewhere may be watching listings sit longer and sellers negotiate. Both can read the same national housing headline that morning.
That is the part I think our industry needs to get better at communicating.
A national average isn’t wrong. It just isn’t your market.
I don’t want this argument misunderstood as criticism of national housing statistics.
FHFA’s national index is doing exactly what it is supposed to do. So are national reports from Census, the National Association of Realtors and other organizations that track housing.
The problem occurs when we take a national measurement and turn it into a description of what an individual consumer should expect.
Consider what “home prices increased 2.1%” actually means.
It does not mean your home increased 2.1%.
FHFA itself makes essentially this point in explaining its House Price Calculator. The agency warns that applying an area’s average appreciation rate does not determine the actual value of a particular house. The property’s condition, age, improvements and local market all matter.
The same principle applies more broadly to housing-market conditions.
National inventory can increase while a particular neighborhood remains desperately short of homes.
National sales can decline while a local market remains competitive.
National home prices can appreciate while a homeowner in another market watches values soften.
A national statistic describes the aggregate. A transaction happens at an address.
Housing professionals live in the distance between those two things.
Today’s new-home numbers make the same point in a different way
The Census Bureau reported that new single-family home sales ran at a seasonally adjusted annual rate of 607,000 in July, down an estimated 10.5% from June’s revised rate.
There is an important qualification attached to that number. Census reported a margin of error of plus or minus 14% around the monthly change, meaning the agency cannot establish from that estimate alone that sales definitively declined from June. The estimated year-over-year change of negative 6.3% carried an even larger margin of error.
That is exactly why housing data deserves more careful reading than the headline often receives.
The same report estimated 488,000 new homes available for sale at the end of July, representing 9.6 months of supply at the current sales pace. The median price of new houses sold was $393,800.
Those are useful national indicators.
They do not tell a builder whether another 150 homes should be started in Phoenix, Charlotte, Salt Lake City or Columbus.
That decision depends on what is happening there: existing inventory, household formation, land costs, employment, migration, competing developments, buyer incomes, incentives, financing conditions and what consumers in that market can actually afford.
We recently wrote about the economics confronting builders, and this is another side of the same issue. America can need additional housing nationally while a builder in a particular submarket can rationally decide that adding another subdivision there today makes no economic sense.
Those statements don’t conflict with each other.
The geography explains why.
Mortgage companies shouldn’t think nationally either
There is a mortgage implication here that doesn’t get enough attention.
Collateral risk is local.
A lender may originate mortgages under the same product guidelines across dozens of states, but the houses securing those mortgages exist in markets behaving very differently.
That doesn’t mean lenders should panic whenever a market experiences a small price decline. Residential mortgages are underwritten with far more information than a regional appreciation number, and short-term price movements don’t automatically create meaningful credit problems.
It does mean that understanding geographic differences matters when lenders think about collateral, servicing portfolios and concentration risk.
The FHFA numbers provide a useful illustration. A national appreciation rate of 2.1% tells a mortgage executive something about the country. It tells considerably less about the risk or opportunity in a particular portfolio concentrated in one metro.
The same applies to mortgage originators on the ground.
A loan officer in a market where inventory has increased substantially needs a different conversation with buyers and real estate agents than an originator working where inventory remains tight. One may be helping borrowers negotiate seller concessions. Another may still be helping buyers prepare to compete.
The mortgage product can be identical.
The market surrounding it isn’t.
Consumers deserve better than the national headline
I think the largest problem is ultimately one of expectations.
Consumers don’t spend their days studying FHFA tables and Census margins of error. They see a headline saying home prices are rising, inventory is increasing or sales are falling and understandably assume it says something about the market they are about to enter.
Sometimes it does.
Sometimes it doesn’t.
That can create unnecessary confusion. A seller hears that prices are rising nationally and expects last year’s appreciation to continue in a neighborhood where inventory has doubled. A buyer hears that the housing market is slowing and expects negotiating leverage in a neighborhood where desirable homes still sell immediately.
The professionals advising those consumers have to undo the national narrative before they can explain the local reality.
We can do better than that.
National housing reporting should provide context, but the industry should increasingly pair it with regional and local information whenever we’re telling consumers what the numbers mean for them.
Not because the national number is misleading.
Because without geography, it is incomplete.
The divergence also changes housing policy
This matters beyond individual transactions.
Washington spends a great deal of time discussing America’s housing shortage. I have argued repeatedly that we need more housing, and I believe that.
I am less convinced that a national housing shortage can be solved effectively with policies that assume every market needs the same thing.
Some communities need substantially more housing production. Others may have enough inventory but lack homes at prices local households can afford. Some need more entry-level ownership opportunities. Others desperately need rental supply. In certain markets, land availability is the constraint. Elsewhere it may be infrastructure, permitting, labor or construction economics.
National policy can help remove barriers and provide financing infrastructure.
The actual housing problem still has to be diagnosed locally.
The FHFA data should remind us of that. When one state is appreciating more than 8% annually while another is declining, those markets are sending different signals. Treating them as though they require identical interventions doesn’t make much sense.
Housing policy should be designed with enough flexibility to recognize that.
Start with the national number. Don’t stop there.
I will continue reading the national housing reports. WRE will continue reporting them. They remain one of the best ways we have to understand where housing is moving across the country.
But I think we need to become more disciplined about what those numbers can tell us.
A national average can identify a trend. It cannot price a listing in Boise. It cannot tell a builder whether to start another community outside Dallas. It cannot tell a first-time buyer how much negotiating leverage exists in Tampa. It cannot tell a lender what collateral conditions look like in a particular concentration of its servicing portfolio.
For those decisions, geography matters more than the headline.
The latest FHFA report says American home prices rose 2.1%.
That is true.
It is also true that underneath that number are hundreds of housing markets moving at different speeds and, increasingly, in different directions.
Maybe the most useful thing we can do with the national number is stop pretending it tells the whole story.

















0 Comments